Asset Specificity

Data on Asset
Liquidation Values

We hand collect the liquidation value of various types of assets liquidation analyses in Chapter 11 filings between 2000 and 2018. In particular, firms in Chapter 11 continue to operate, but they are required to report the liquidation values of all of their assets if they were liquidated. We describe the steps of the data collection below. We have performed a number of checks for the informativeness and eneralizability of this data, which we summarize at the end.

We begin with a list of US public companies that emerge from Chapter 11 from New Generation Research (NGR)’s BankruptcyData. We retrieve their liquidation analyses  from Public Access to Court Electronic Records (PACER) and BankruptcyData. The liquidation analysis is part of the disclosure statement associated with the Chapter 11 plan. When a case has multiple disclosure statements, we use the earliest version. If the liquidaion analysis is not available in the first disclosure statement, we then use the latest one.

1

The liquidation analysis typically includes a summary table with the net book value, liquidation value, and liquidation recovery rate (liquidation value as a fraction of net book value) for each main category of asset (e.g., PPE, inventory, receivable) and for the firm as a whole, together with notes that explain the sources and assumptions of the estimates. We use the midpoint estimate of the liquidation value in the summary table and the average of high and low estimates when the midpoint is not available. See an example of the liquidation analysis summary table from Lyondell Chemical here.

See the full liquidation analysis with more detailed information here.

Our main dataset relies on public companies for the main dataset because information is considerably harder to obtain for private companies. For instance, most bankruptcy filings do not contain an industry classification of the company. For public firms, NGR has assembled background company information including SIC codes, which we checked by hand using industry codes reported for their SEC registration. For private firms, it is difficult to find reliable industry classification just based on company name in the bankruptcy filing. It is also more common that we cannot find the liquidation analysis document in PACER.  However, we do collect additional data using the list of “Large Private Filings” compiled by the NGR, where they cleaned the filing data and collected SIC codes.

For each type of asset, we also construct average liquidation recovery rate in an industry. The main asset categories include fixed assets (PPE), inventory, receivable, and book intangible, which correspond to the standard categories in financial statements. Each industry is a two-digit SIC code. Averaging by industry has two functions. First, the industry-level measures can reduce  idiosyncratic noise at the individual case level. Second, they  can be extended to firms in each industry more broadly.

2

Liquidation Value over Time
(Compustat Aggregate)

3

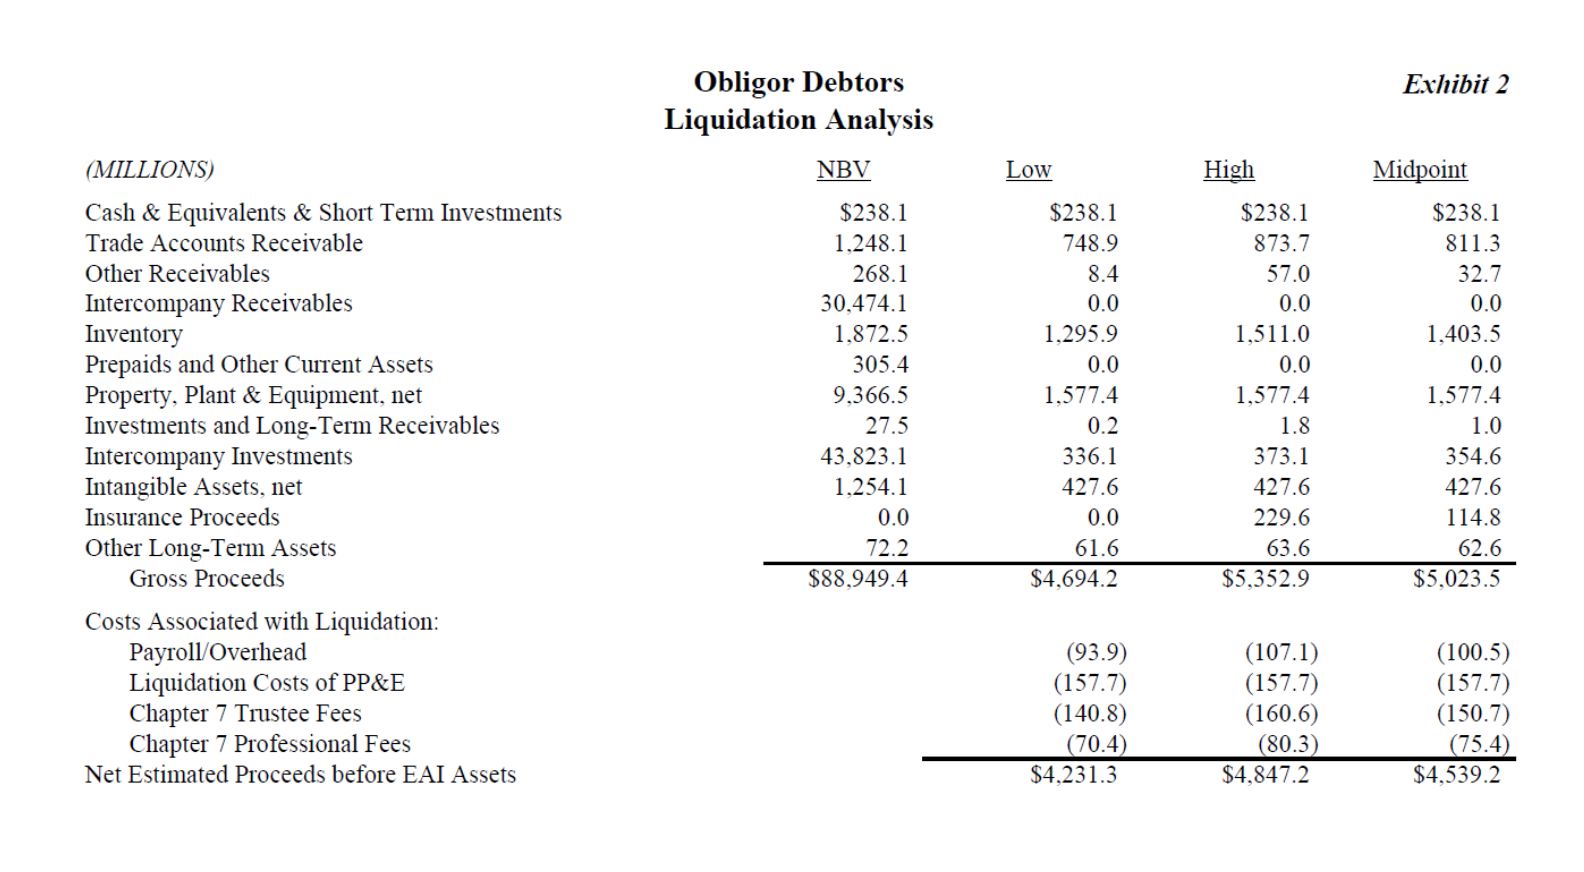
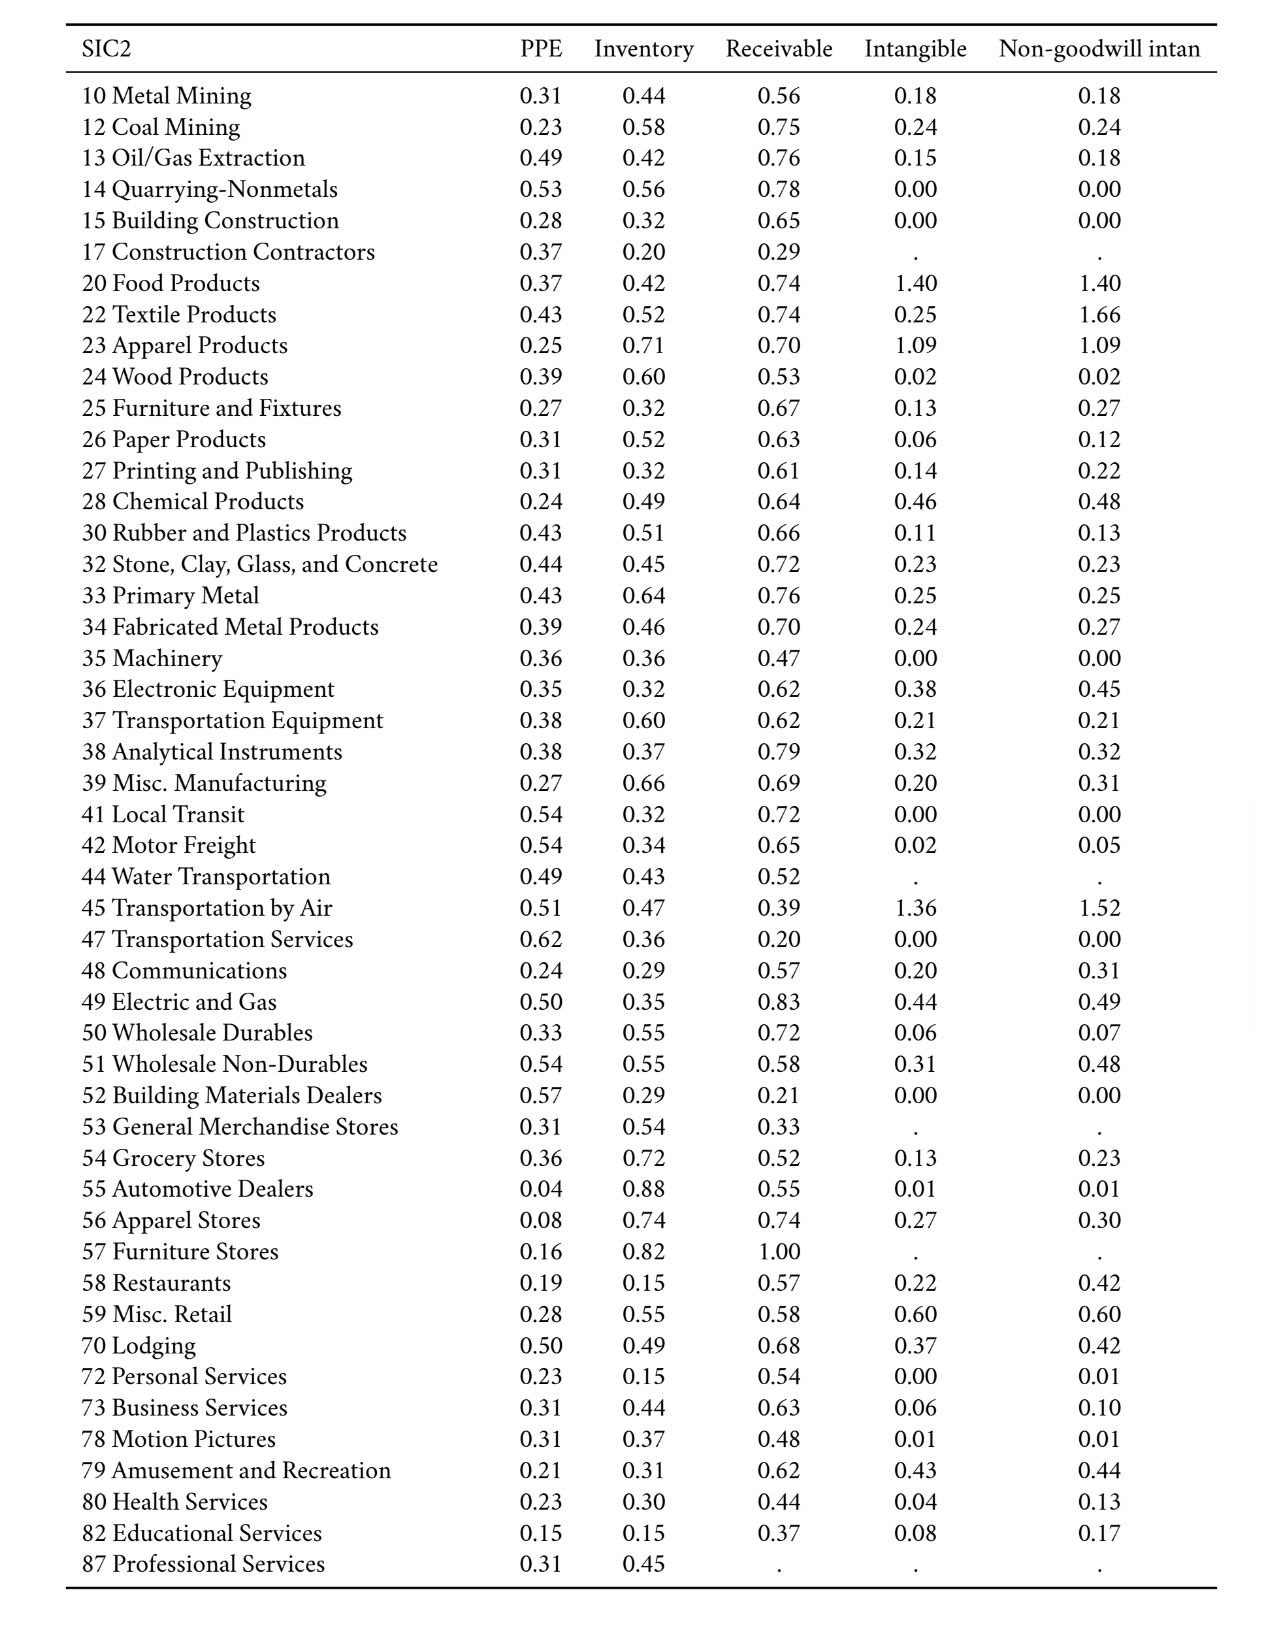
3. Using the industry-level liquidation recovery rate, we can calculate the estimated firm-level liquidation value for firms in Compustat: where Liq i,t  is the total liquidation value of firm  i   at time  t  ,  j   denotes the asset type (e.g., PPE, inventory), λ i,j is the industry-average liquidation recovery rate for this type of asset (based on the firm’s industry), and K i,j,t is the book value of asset   j   for firm  i   at time  t .

Checks for Data Informativeness
and Generalizability

We perform extensive analyses to verify the informativeness and generalizability of the liquidation recovery rate data.

We show that liquidation recovery rates in our data align with results using auction data, which are available for equipment in aerospace manufacturing and construction.

The liquidation values reported in our data are also consistent with liquidation proceeds realized in Chapter 7 (unfortunately Chapter 7 cases mainly report total liquidation proceeds realized by the trustee without well-organized information on the liquidation values for each category of assets).

The average liquidation recovery rates in our data align closely with benchmarks used by creditors when they lend against particular assets such as PPE and working capital, which reflect their assessments of the liquidation values of non-financial firms in general. These assessments come from appraisals performed by asset liquidation and valuation specialists, who conduct field exams and simulate live liquidations. For instance, lenders on average lend 20\% to 30\% against the book value of PPE, which is similar to the average PPE liquidation recovery rate of 35\% in our data.

We show that the liquidation recovery rates are well-explained by the physical attributes of assets used in different industries (e.g., transportation costs, degree of customization, and durability), measured independently based on industry-wide data from the Bureau of Economic Analysis (BEA). Indeed, our data implies that if fixed assets in an industry had no transportation costs, no customization, and no depreciation, then the liquidation recovery rate would be slightly above 100%.

These checks verify that our data is consistent with market-based transactions and we do not find evidence of systematic biases. Furthermore, although we rely on detailed reporting by firms in Chapter 11, the information is applicable to non-financial firms more generally (our checks using auction data, lending benchmarks, physical attributes of assets all use information from firms outside bankruptcy); we do not find that our data systematically understates liquidation recovery rates relative to other data sources. Inevitably the measures may contain some noise that could attenuate our results, and we show that they have substantial explanatory power for the investment behavior and financing decisions of non-financial firms.