Asset Specificity

Physical Attributes and
Liquidation Values

Overview

We analyze the determinants of asset specificity and document that assets’ physical attributes  (e.g., mobility, durability, and customization) play a crucial role. We used fixed assets as the main example.

Explanatory Power of Physical Attributes

We analyze three physical attributes that affect the specificity of PPE.

Mobility

The first attribute is mobility: some assets are mobile (e.g., aircraft, ships, vehicles), which helps them reach alternative users more easily, whereas other assets are costly to transport or location-specific (e.g., assembly lines, roller coasters).

Durability

The second attribute is durability: reallocation takes time, and assets that depreciate faster can be less valuable by the time they reach alternative users (fresh food is an extreme example).

Degree of Customization

The third attribute is the degree of customization: some assets are standardized or readily usable by other firms, while other assets are customized for a particular user.

These three attributes can be measured consistently for all types of assets across industries. All of them affect the distribution of the asset’s productivity for alternative users: if an asset is less mobile, less durable, or more customized, there will be fewer alternative users with high valuation and the liquidation recovery rate will be lower.  

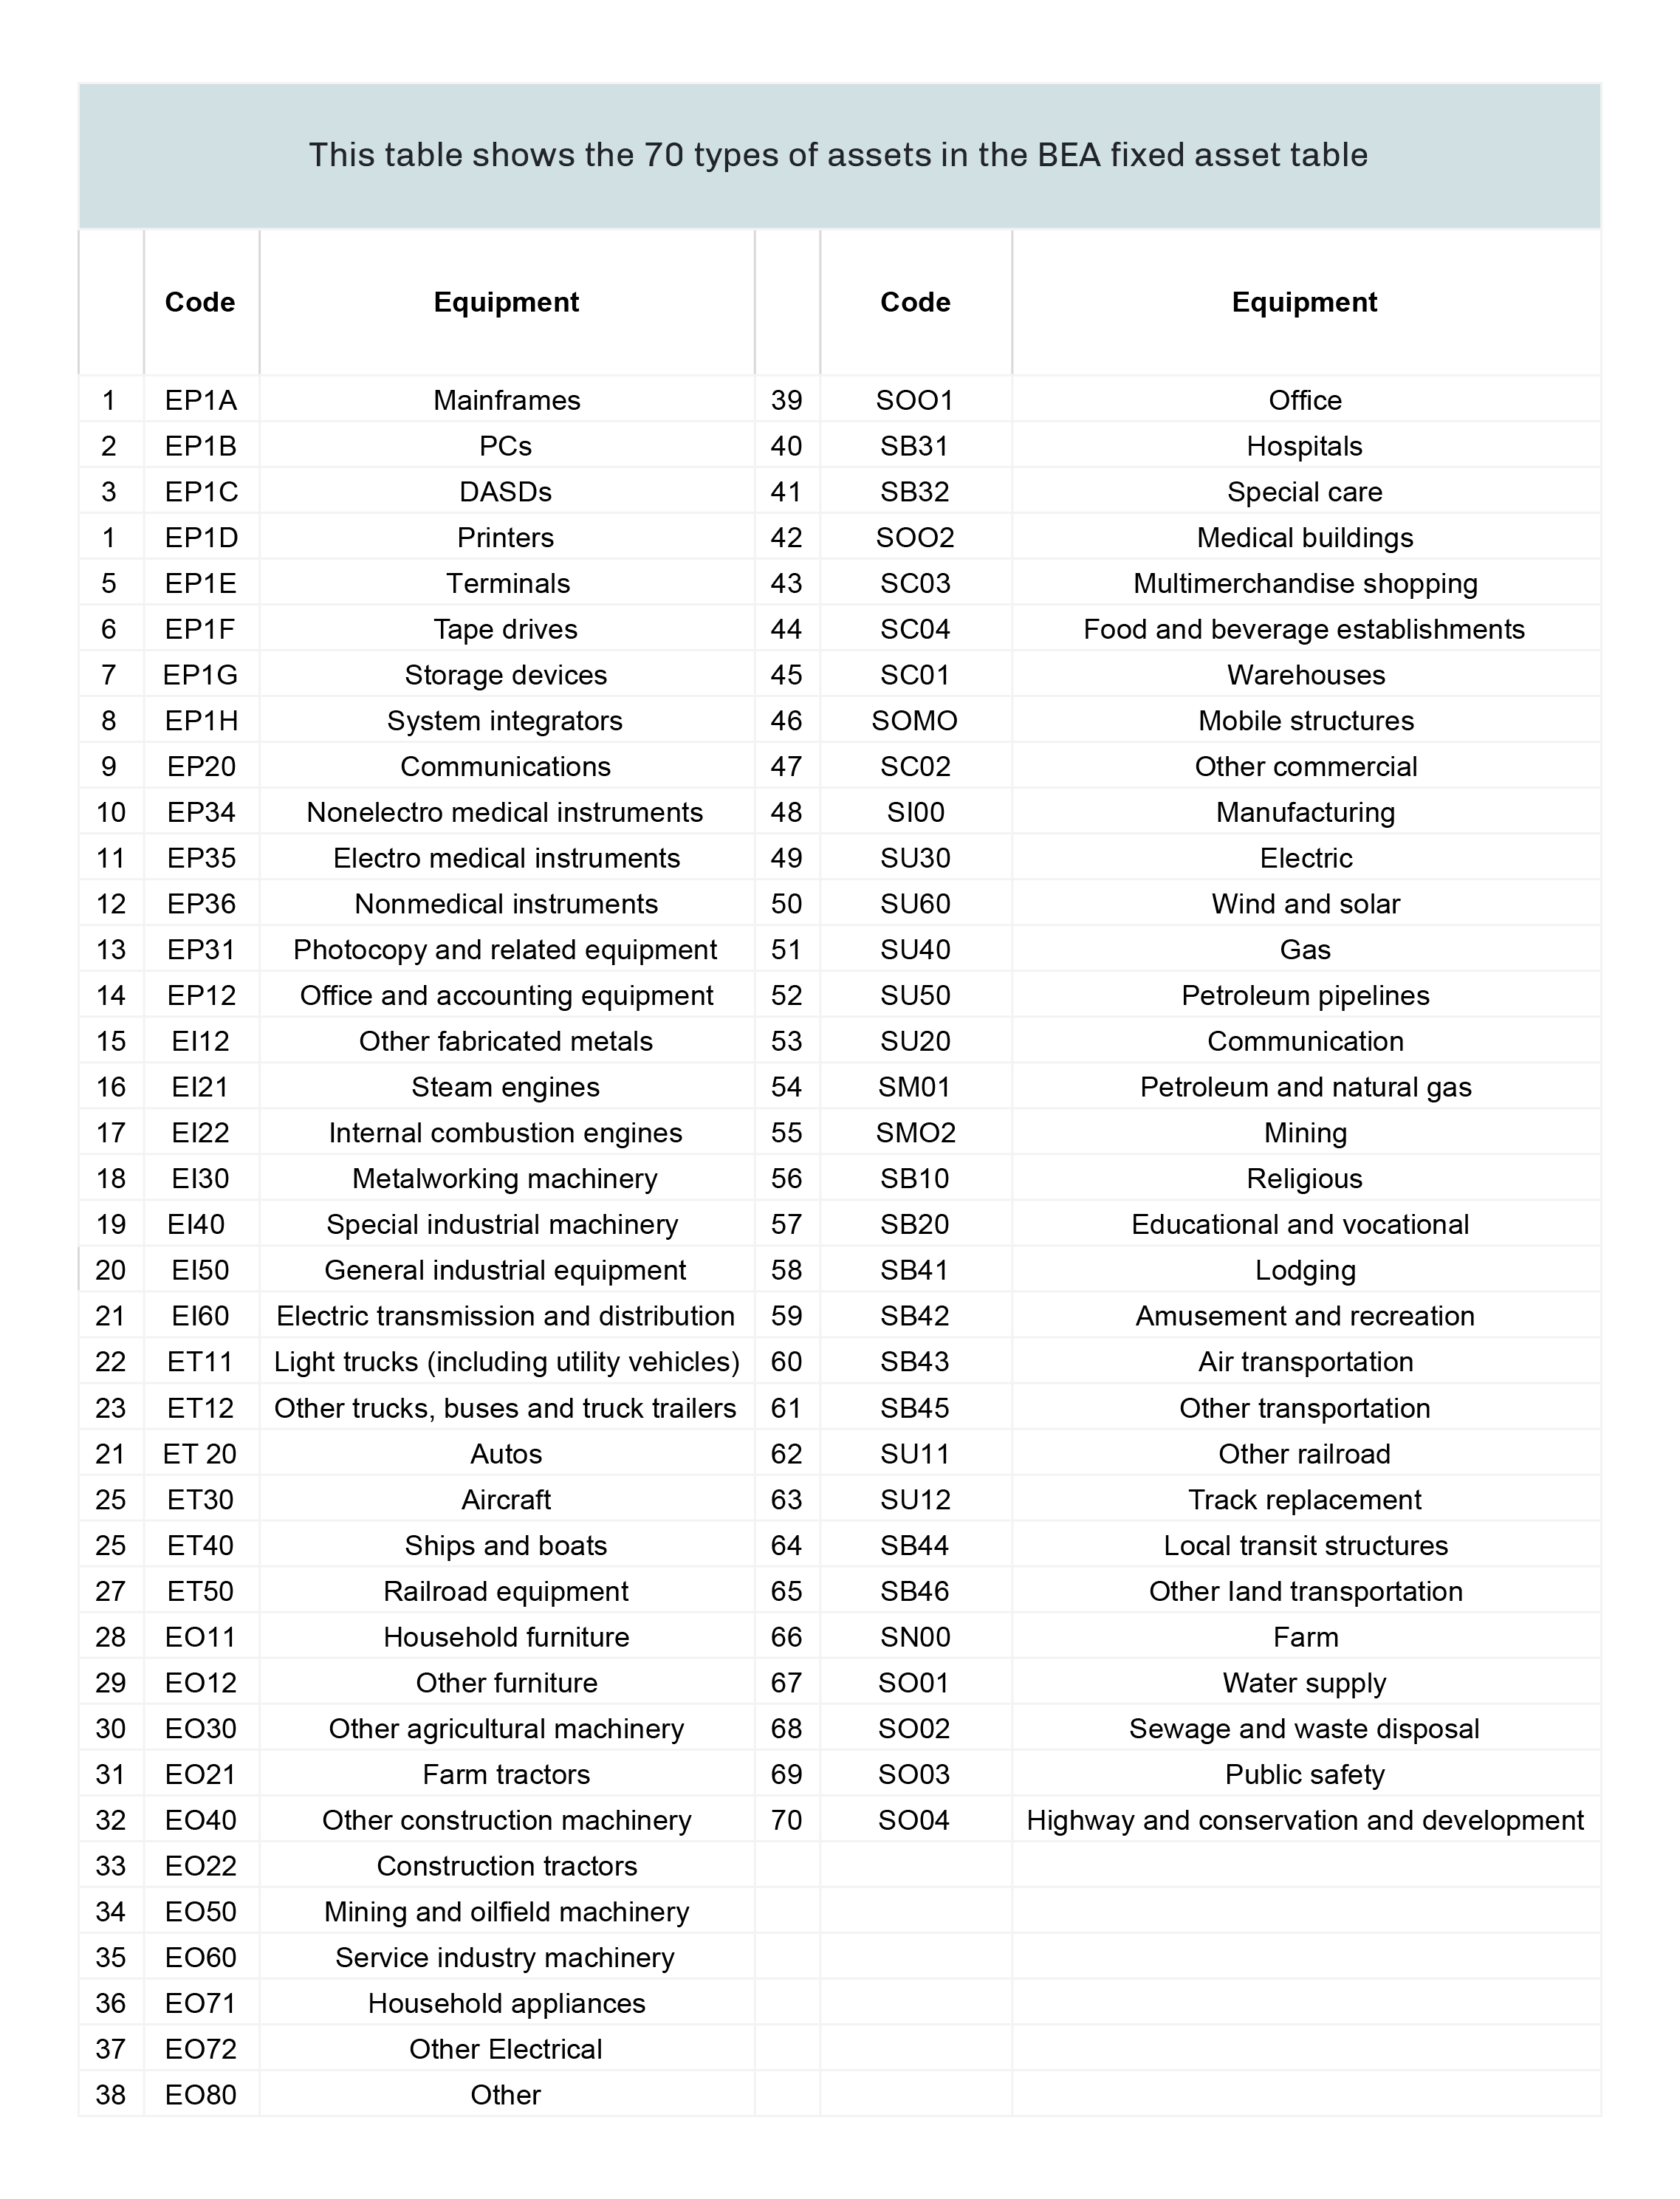
To study the physical attributes of PPE in each industry, a helpful starting point is the BEA’s fixed asset table, which records the stock of 38 types of equipment and 32 types of structures across 58 BEA industries (we exclude the category “nuclear fuel,” which does not appear to be a type of fixed asset), see here. We denote the fixed asset stock as  K i,j , where  i   is a BEA industry and  j   is one type of fixed asset. We analyze the physical attributes of each type of fixed asset  j  , and then assess the overall characteristics of PPE in an industry  i   using the fixed asset composition (the share of  K i,j  in
Mobility
We measure the mobility mfor each type of equipment using the ratio of its transportation costs (from producers to users)  to its production costs, which we obtain from the BEA’s input-output table.  Transportation cost data is available for equipment, but it is not well-defined among structures. Therefore we construct the transportation cost measure for the 38 types of equipment in the BEA fixed asset table, and control for the equipment share in total fixed assets (around 50% in the average industry). To verify the informativeness of the transportation cost data, we also collect data on the weight to value ratio for each type of equipment from the Census Commodity Flow Survey (CFS). We find that the transportation cost measure is significantly higher for heavier assets.

To verify we calculate the industry-level PPE mobility M i   by taking the weighted average across the 71 types of assets, where the weight is the share of the asset in the industry’s total fixed asset stock based on the BEA fixed asset table:


Accordingly, the industry-level mobility measure is the ratio of total transportation costs of all PPE to the total production costs of all PPE. We match BEA industries with two-digit SICs  (the industry codes in our liquidation value data).

Customization
We construct a proxy for the degree of customization c j   for each type of PPE using the share of design costs in its total production costs. The idea is that customized assets tend to require more design. For each of the 70 fixed assets, we calculate this share using the BEA’s input-output table (i.e., we look at what it takes to produce each type of PPE). We calculate design and related costs using the following categories: design, information services, data processing services, custom computer programming services, research, advertising, management consulting, business support services, and miscellaneous professional and technical services. Specifically, we find the sector that produces each type of PPE in the input-output table and record how much it spends on design. To check the reliability of the customization measure, we build on the idea that customized assets are less likely to be sold through wholesalers and retailers. For each type of equipment, we can use the CFS data to calculate the fraction of its total domestic shipment where the shipper is a wholesaler or a retailers (unfortunately we cannot apply this check to structures). We find that this measure is negatively correlated with our customization measure.

To check we calculate the industry-level PPE customization Cby taking the weighted average across the 71 types of assets:


Correspondingly, the industry-level customization measure is the share of design costs in total production costs of all PPE in each industry.  We match BEA industries with two-digit SICs.

Durability

We measure the durability of assets using depreciation rates. The simplest approach is to calculate the average depreciation rate of PPE  (depreciation divided by lagged PPE) in each two-digit SIC industry using Compustat data, which avoids translating BEA industries to SIC.

Explanatory Power of Physical Attributes

We find that industries where PPE has high transportation costs, high degrees of customization, or high depreciation rates have low PPE liquidation values. In addition, the results imply that when physical frictions for reallocation are absent—namely  if PPE is costless to transport, fully durable, and not customized—then the liquidation recovery rate would be  slightly over 100%. In other words, the physical attributes perform well in explaining why the level of liquidation recovery rate is less than one in most industries. Finally, we find that the physical attributes we can measure explain 30% to 40% of the variation in the liquidation recovery rate of fixed assets across industries.

In terms of the economic magnitude, based on column (1) a one standard deviation change in mobility (transportation cost),  customization (design cost), and durability (depreciation rate) is associated with changes in PPE liquidation recovery rate of 0.36, 1.15, and 0.35 standard deviations respectively. Another assessment is to calculate how much the PPE liquidation recovery rate is predicted to change if we set each of the three variable to zero. If we set the transportation cost measure to zero, then PPE liquidation recovery rate would increase by 12 percentage points on average. The values for  design intensity and depreciation rate are 58 and 11 percentage points, respectively.